Reading MOOG Servo Valve Flow and Frequency Response: D661 vs D634
Rated flow and frequency response help assess whether a MOOG servo valve fits a machine's requirements. This article uses newly drawn charts based on the flow ratings and amplitude response curves in the two valve catalogs to explain flow capacity and dynamic tracking.
The comparison covers the D661-G…A and analog-interface D634. The flow chart uses tabulated values. The amplitude response chart uses approximate points read from the published curves, with the test conditions retained for each valve.
MOOG D661 series and published models
Compare rated flow at the same pressure drop
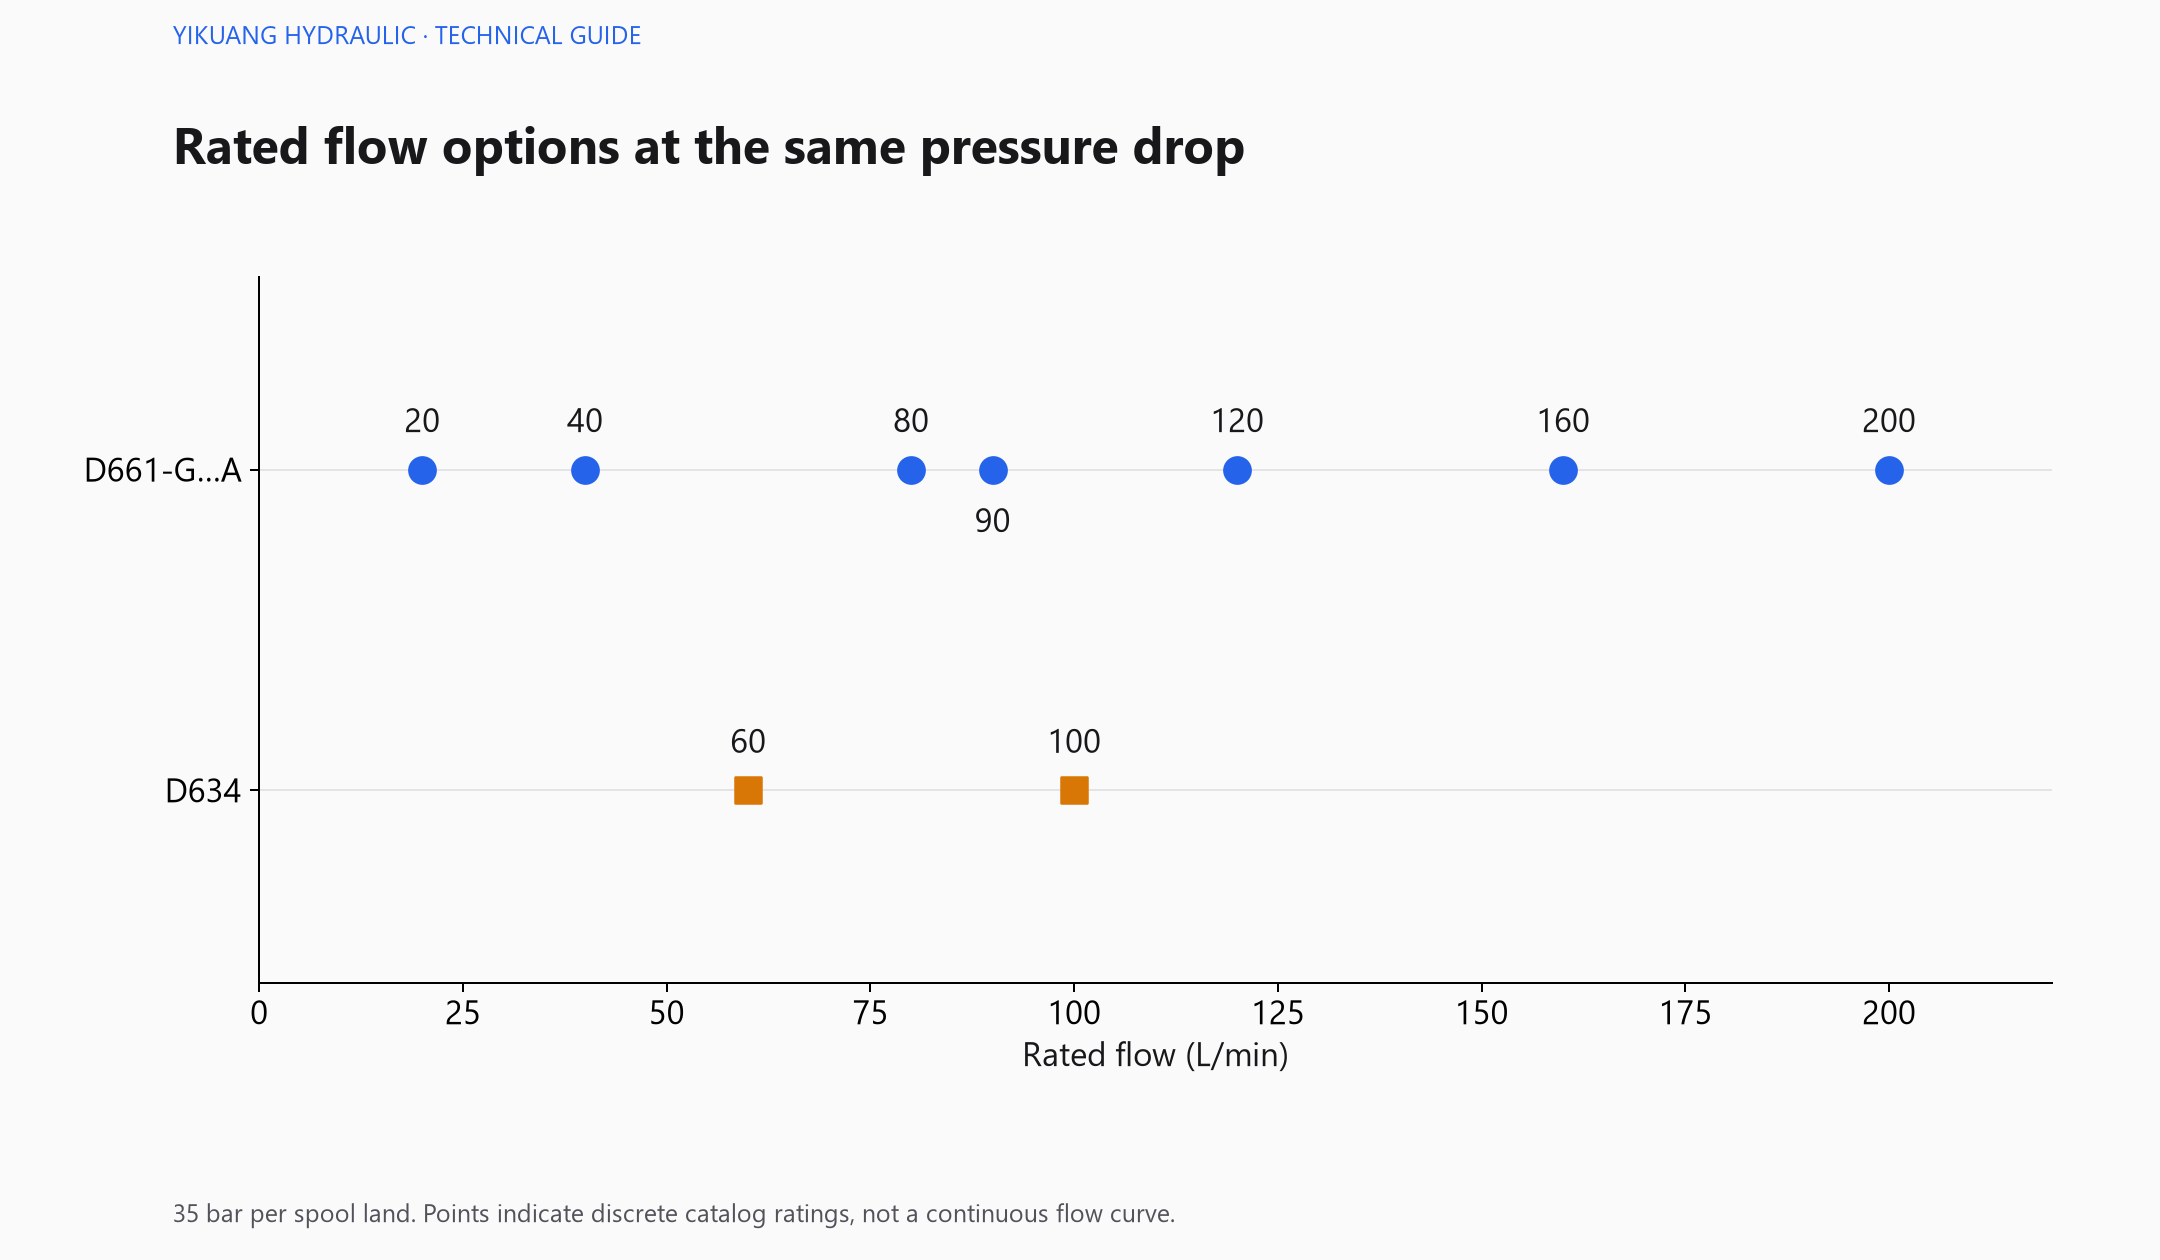
The D661-G…A standard rated flows are 20, 40, 80, 90, 120, 160 and 200 L/min. The D634 ratings are 60 and 100 L/min. A common rated pressure drop provides a basis for comparing these values.
MOOG D634 series and published models
A typical four-way flow path passes through a supply-side and a return-side metering edge. A pressure drop of 35 bar per land therefore corresponds to a total valve pressure drop of 70 bar. Pump pressure also has to overcome the load and line losses, so the pressure drop available across the valve needs a separate calculation.
I would start by calculating the required flow from cylinder effective area and target speed, then estimate load pressure and line losses. A higher rated flow indicates greater metering capacity under the specified conditions. The appropriate rating also depends on the control range, spool characteristics and machine requirements.
At a fixed opening, flow through a sharp-edged metering orifice can be estimated using the square-root relationship with pressure drop. For a rating of 100 L/min at a total valve pressure drop of 70 bar, reducing the drop to 17.5 bar gives an estimated flow of about 50 L/min. Fluid conditions and valve operating limits also affect the actual result.
Start with the required movement amplitude
Frequency response testing applies a periodic command, increases its frequency and measures the amplitude and phase of spool movement. Different command amplitudes require different spool strokes and speeds, so a valve can have several response curves.
This chart uses the 90% amplitude curve for the D661-G…A 40/80 L/min group and the ±90% amplitude curve for the D634. The published charts do not provide individual test data points. The values shown here are approximate readings converted from chart coordinates and connected with straight lines to show the trend.
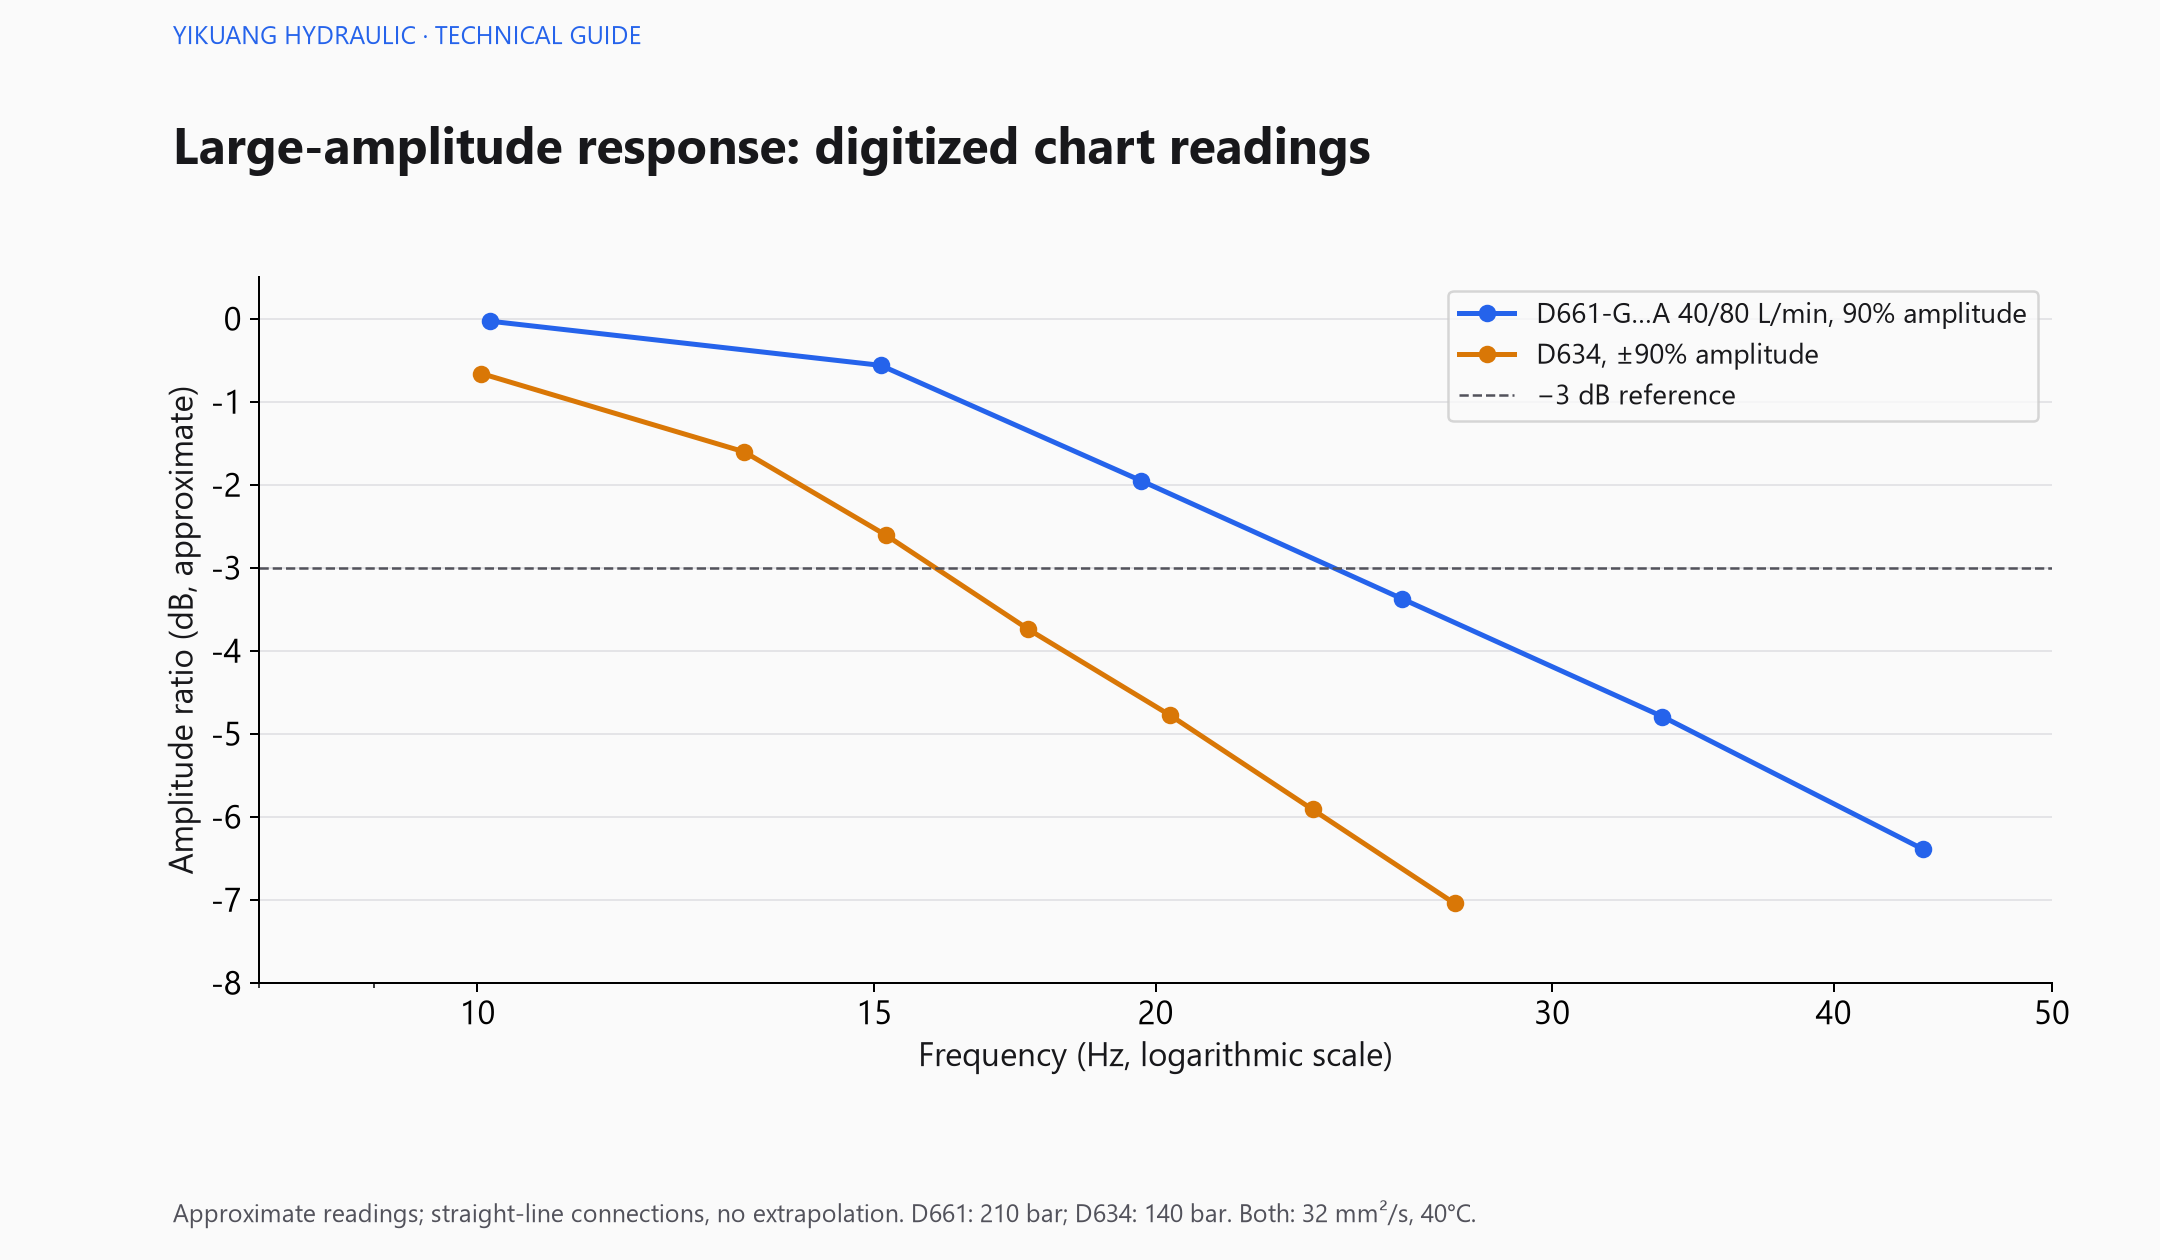
The horizontal axis shows frequency on a logarithmic scale. The vertical axis shows amplitude ratio in dB. Near 0 dB, the output amplitude is largely maintained relative to the normalized reference. Both selected curves show attenuation as frequency increases.
An amplitude ratio of −3 dB corresponds to about 70.8% of the reference amplitude; −6 dB corresponds to about 50.1%. The dashed line helps locate attenuation on the chart. These values describe dynamic amplitude and cannot be treated as the same percentage loss in steady-state flow.
The chart represents only the selected amplitudes and test conditions. Test pressures differ, and the points are approximate chart readings. They do not establish which valve will be faster on the same machine. For small corrective movements, review curves at amplitudes closer to the application.
Check phase as well as amplitude
An output can retain much of its amplitude while already exhibiting substantial phase lag. Phase describes the timing relationship between spool movement and the periodic command. Control system assessment should consider both amplitude and phase.
At 20 Hz, for example, a 90° lag represents a quarter of a cycle, or about 12.5 ms. This is a phase relationship at that frequency, rather than a fixed valve delay or step response time. Figure 2 redraws amplitude response points only; it does not reconstruct the phase response curves.
Apply the data to the machine
Use required flow and available pressure drop to narrow the flow options, then assess dynamic requirements against movement frequency and command amplitude. Include the D661 pilot supply and the D634 direct-drive design in the circuit analysis.
Spool position response is one part of the machine's overall response. The cylinder, fluid compressibility, piping, sensors and external controller all affect the final movement. Valve data support selection; system analysis and commissioning establish the machine's actual performance.
For a selection assessment, record the complete valve designation, required flow, available pressure drop, movement frequency, command amplitude and oil temperature. For construction and supply requirements, see the MOOG D661 vs D634 comparison.