MOOG D691-2702G Used Valve Test Curve Analysis
This analysis concerns a used MOOG D691-2702G valve. Its sweep curves rise continuously overall, while an enlarged view reveals small fluctuations and short changes in the curve shape.
Increased resistance to spool movement is considered a possible explanation for uneven local tracking. This interpretation is based on the curve shape and has not been verified by teardown inspection.
Continuous overall response, uneven local behavior
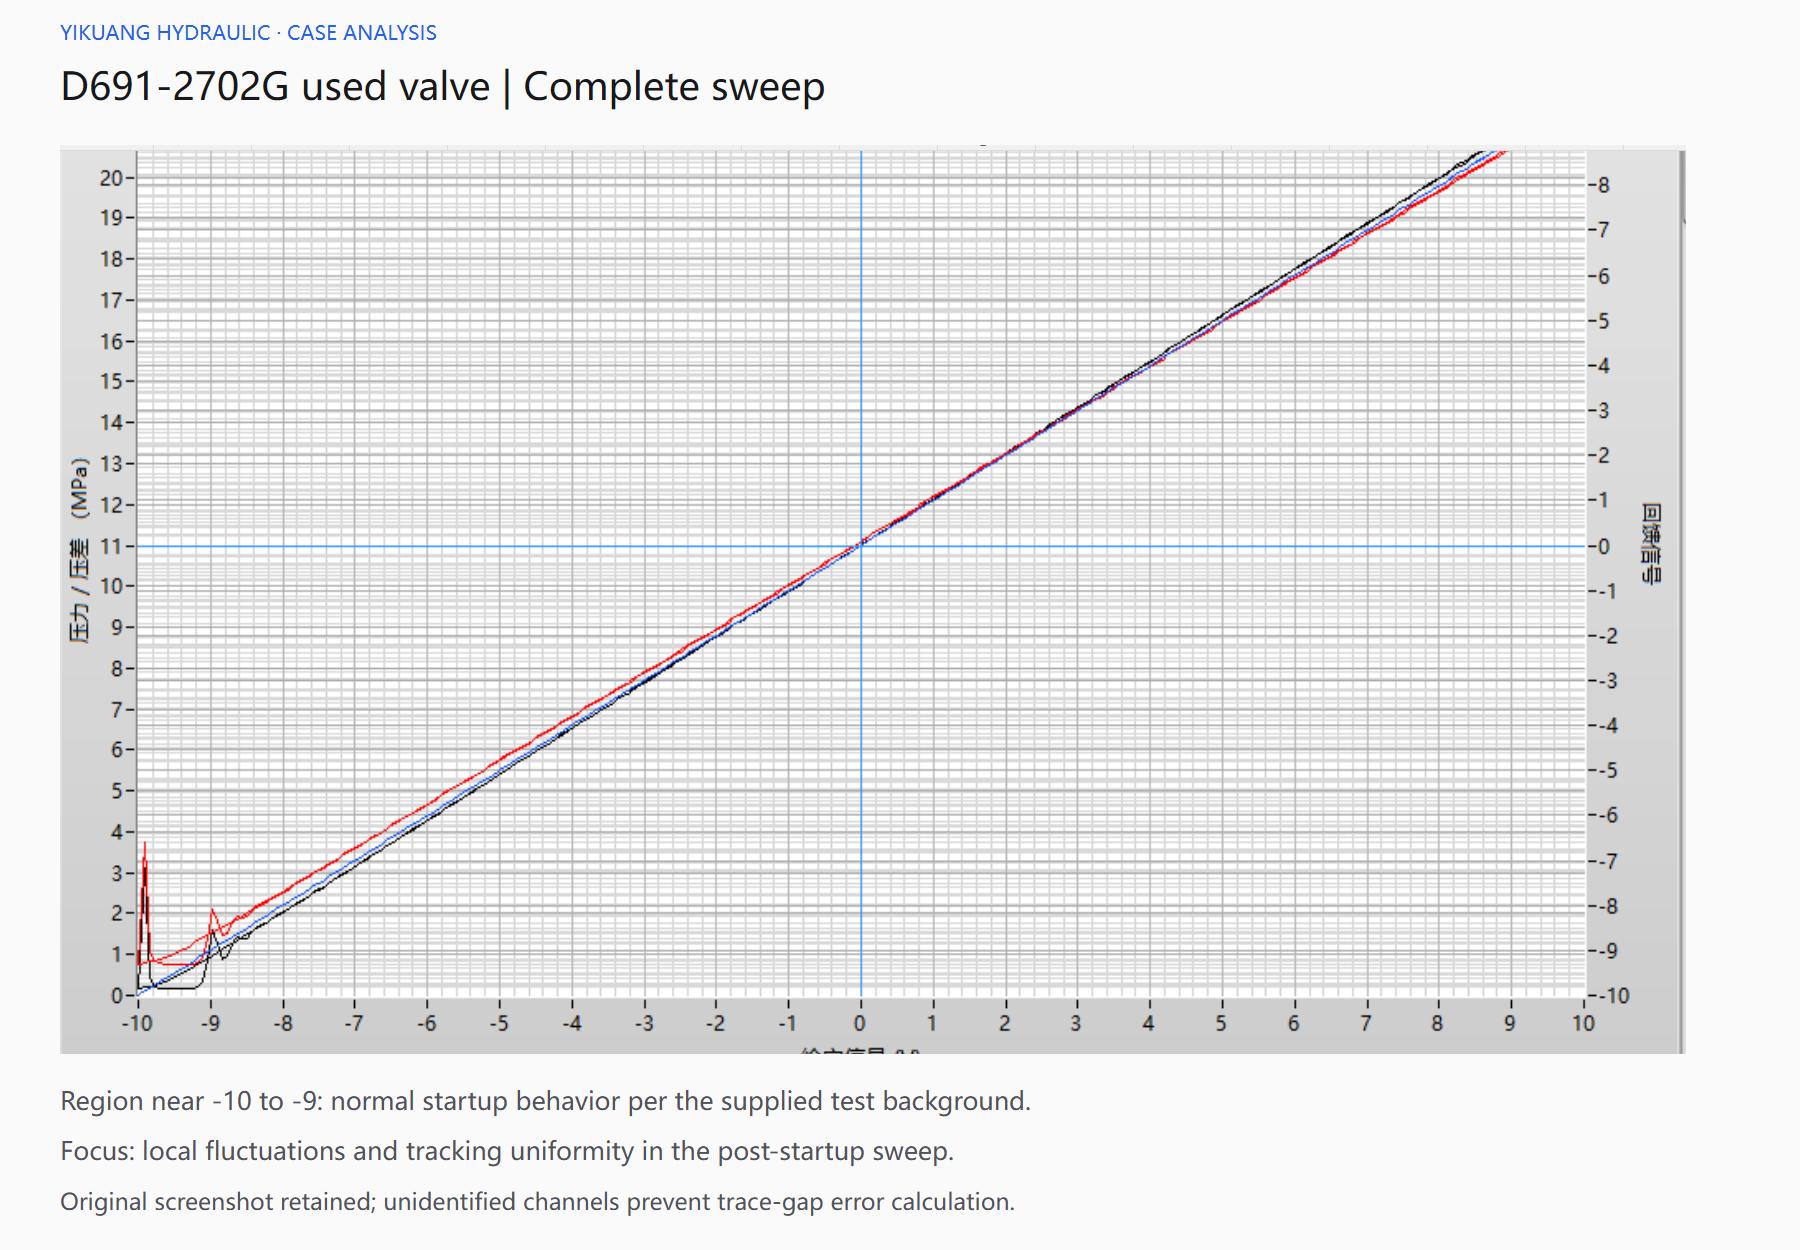
Most of the sweep appears approximately linear, with no obvious extended interruption. The enlarged view shows small fluctuations during the rise, with a less uniform rate of change at some points.
The overall trend can conceal these details. A valve may still respond across a broad input range while exhibiting a brief local lag followed by a more concentrated change as the input increases.
The analysis focuses on the continuous sweep after startup. Pressure and feedback use different vertical axes, and the signal channels have not been identified. Distances between traces are therefore not converted into tracking errors or used to declare a limit violation.
Why consider resistance to spool movement?
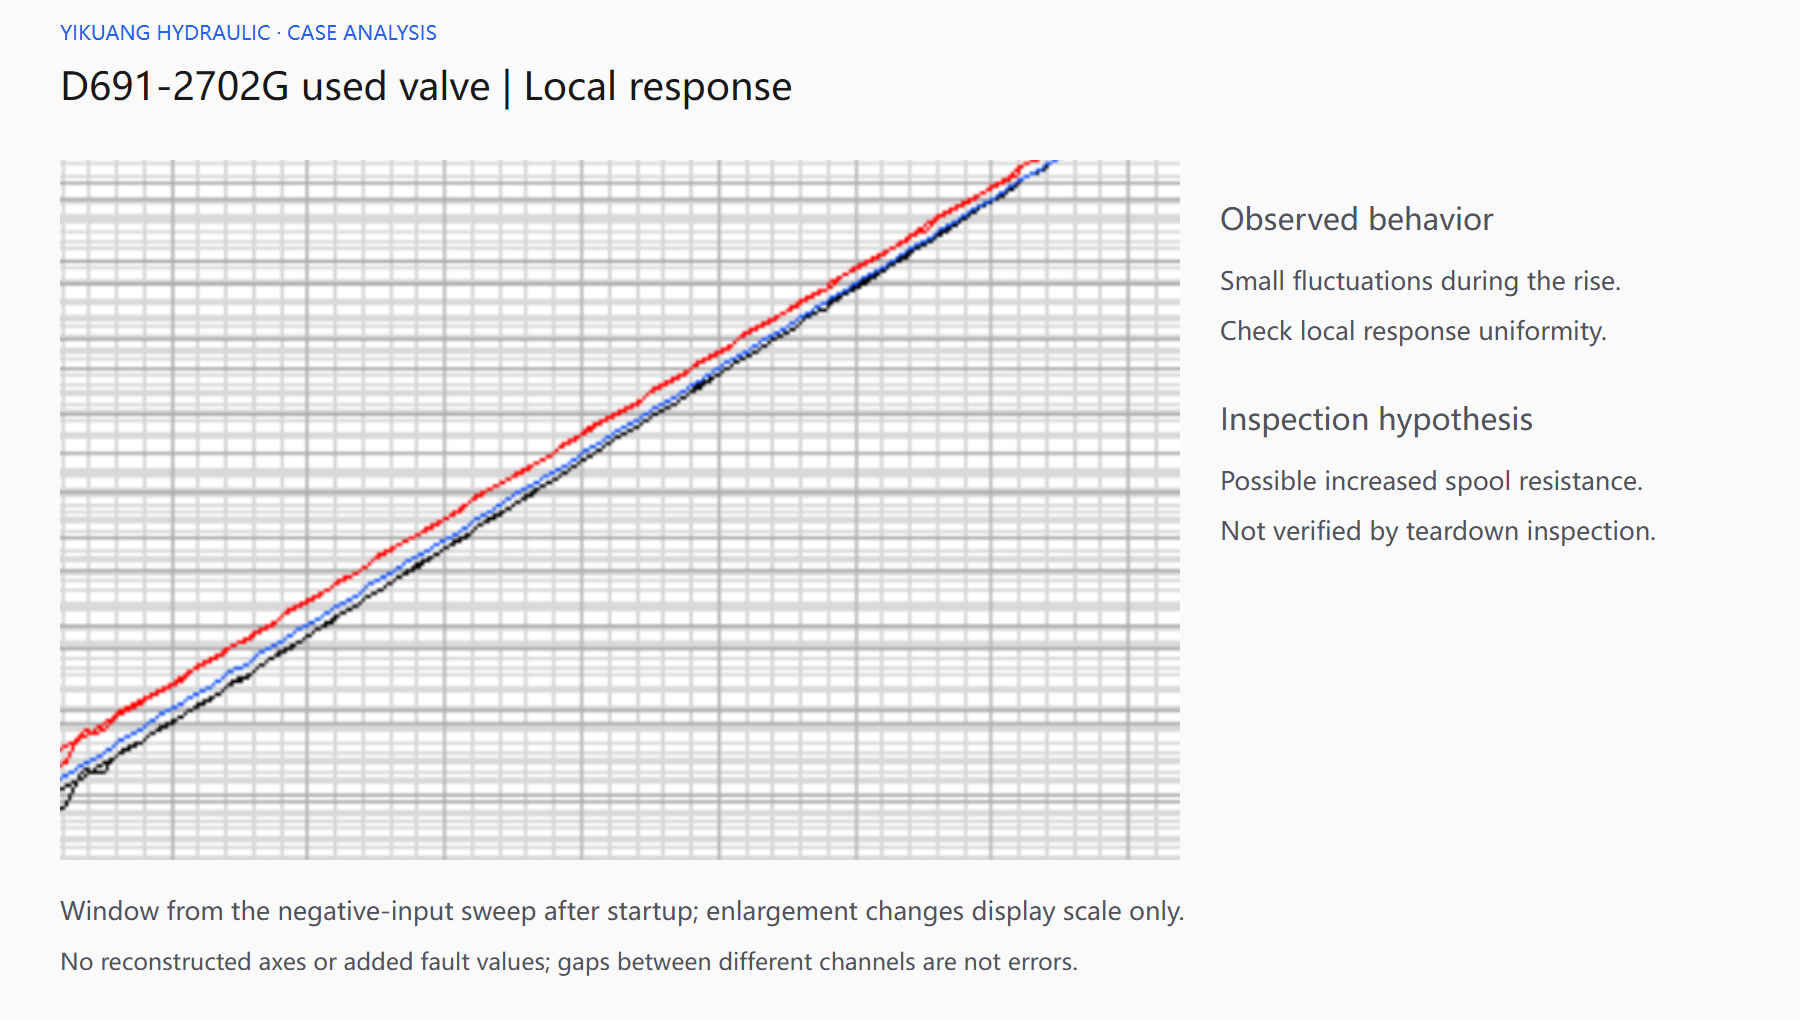
Spool movement has to overcome friction. If resistance increases, a small change in drive force may initially be insufficient to move the spool. As the drive force increases further, movement can begin and the resulting output change may become concentrated over a shorter input interval.
This mechanism can produce an uneven local input-output relationship. The overall curve can remain approximately linear while short irregularities or changes in incremental response become visible on closer inspection.
Contamination and the condition of a used valve make this a worthwhile inspection direction. Deposits can affect movement, and pilot-stage conditions can affect the main spool drive. The curves cannot distinguish these causes, so increased movement resistance remains a hypothesis.
Possible effects on machine control
Uneven local tracking is more relevant to small adjustments. Where a machine needs a slow, continuous output change, an initially limited response followed by a concentrated change can make adjustment less smooth.
An external controller may continue correcting the command, influencing the resulting response. The effect may be less apparent in applications dominated by large switching movements. Continuous pressure adjustment, low-speed motion and small corrective movements deserve separate assessment.
These are possible application effects. No machine motion record has been supplied for this case.
What the typical catalog curves show
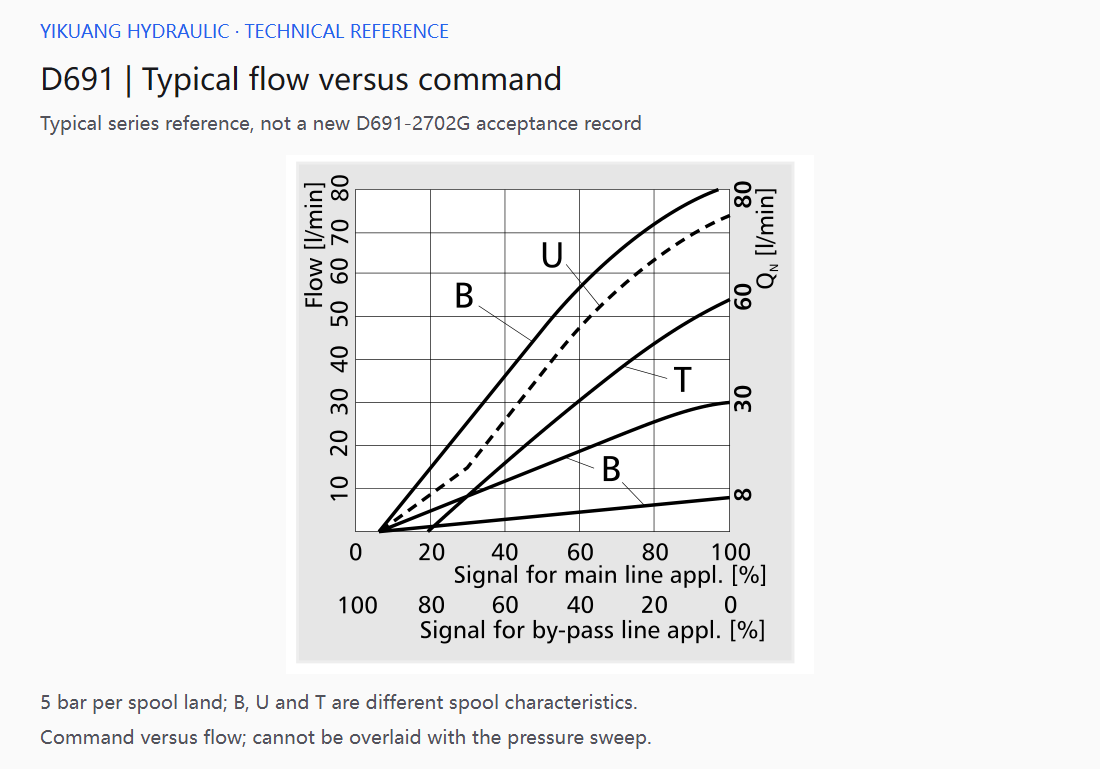
The flow-versus-command curves illustrate the relationship for specified pressure drops and spool configurations. Different spool characteristics produce different shapes. The actual ordering configuration must be established before treating a particular curve as the relevant reference.
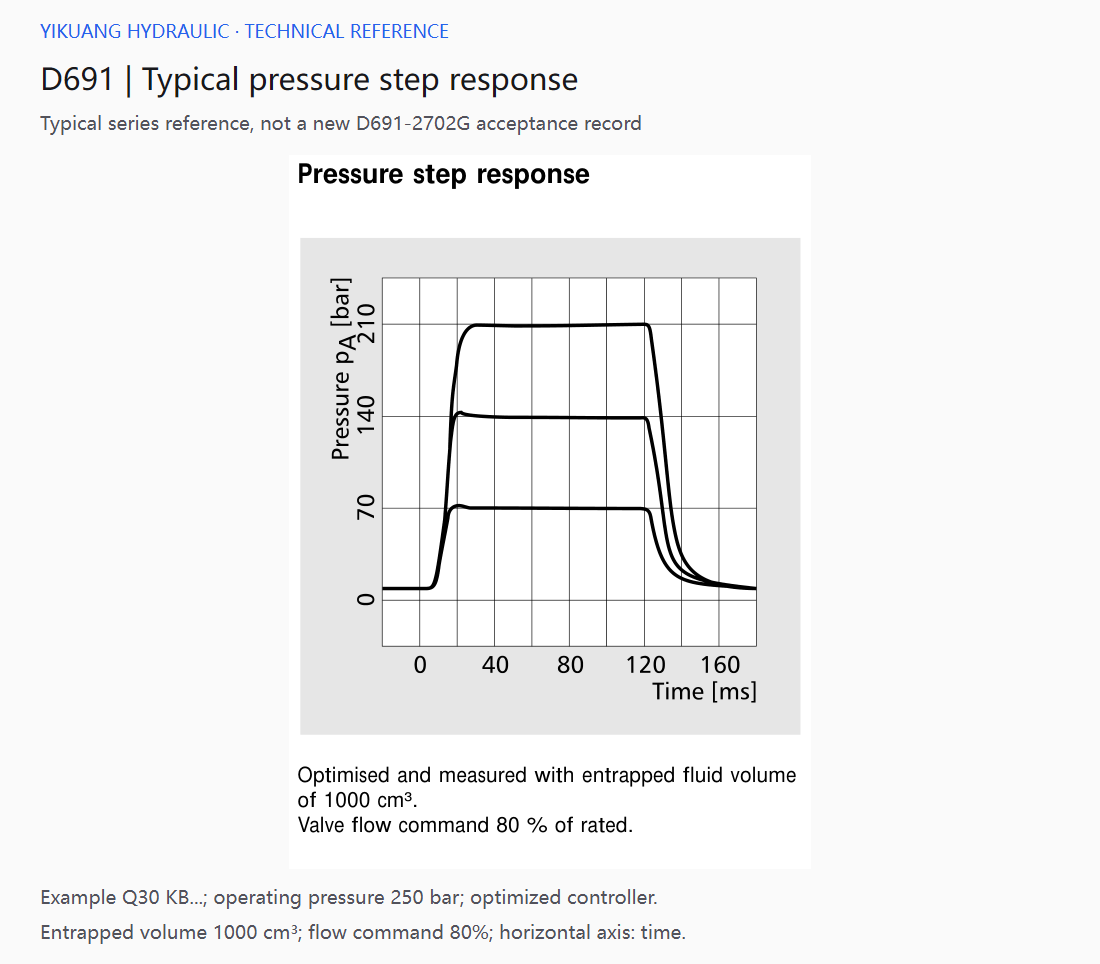
Figure 4 shows pressure building and settling. The catalog also illustrates the influence of fluid volume and controller matching on pressure response. Supply, load and control conditions therefore belong in the assessment of the used valve's local fluctuations.
The supplied screenshot plots the input sweep, whereas the pressure step chart plots time. They represent a sweep relationship and a dynamic process respectively and cannot be overlaid point by point. The catalog charts are typical series references, not individual acceptance records for a new D691-2702G, and do not establish authenticity.
Inspection priorities
For the movement-resistance hypothesis, inspect spool movement components, pilot supply and fluid contamination while checking the stability of the input and measurement signals.
Repeat sweeps should use consistent sweep speed, oil temperature and pressure. Check whether the fluctuations recur at the same positions. Any post-treatment comparison should use the same conditions to assess changes in response uniformity.
The present record shows a continuous overall response with uneven local tracking. Increased spool movement resistance is a possible explanation and a direction for further inspection. The affected components and any repair outcome require inspection and repeat testing to confirm.