Why a Servo Valve Can Pass Bench Testing but Perform Poorly on the Machine
Flow looks normal on the test stand and the sweep curves are stable, yet the machine moves slowly, pressure fluctuates or position drifts after the valve is reinstalled. Both the repair report and the machine conditions matter: which items were tested, and what was happening when the problem appeared?
A sweep at fixed pressure and a rapid movement under load assess different behavior. Even when the spool follows the command, the hydraulic circuit has to move the load and the machine controller has to regulate the motion.
Start with the scope of the test report
If the report covers only null and static flow, use it to assess those items. Rapid reversals, continuous pressure control and holding after warm-up require the relevant dynamic and operating-condition records.
For example, a stand may slowly vary the input at stable pressure and oil temperature, producing a continuous curve. Rapid commands and changing machine loads introduce conditions that the sweep did not cover.
For valves with spool feedback, distinguish what is being measured. Spool position feedback indicates valve opening. Cylinder position and speed depend on actual flow, pressure and load. Comparing the signals helps identify where the motion starts to lag.
Load leaves less pressure drop available across the valve
At the same opening, a lower pressure drop produces less flow. Pump pressure has to overcome the load as well as line and return losses. The remainder is the pressure drop available across the valve.
Consider a simplified example. At a specified opening and a total valve pressure drop of 70 bar, a valve delivers 40 L/min on the stand. The machine cylinder has an effective area of 20 cm² and a target speed of 0.30 m/s, requiring 36 L/min. The bench flow suggests some margin at that operating point.
On the machine, load and circuit losses leave a total valve pressure drop of only 17.5 bar. With the opening unchanged, the square-root relationship gives an estimated flow of 40 × √(17.5 ÷ 70), or about 20 L/min.
For the same effective area, 20 L/min corresponds to a theoretical cylinder speed of about 0.167 m/s, below the 0.30 m/s target. The spool can follow the command while the cylinder still appears slow.
In this example, available pressure drop under load and supply conditions deserve attention before reassessing the valve operating point. Whether a larger command will help depends on remaining opening, pump capacity and valve operating limits.
This is a calculation example, not a repair record. It assumes flow enters the selected effective chamber and neglects leakage. An actual machine also requires consideration of opposite-chamber pressure, unequal areas and circuit losses.
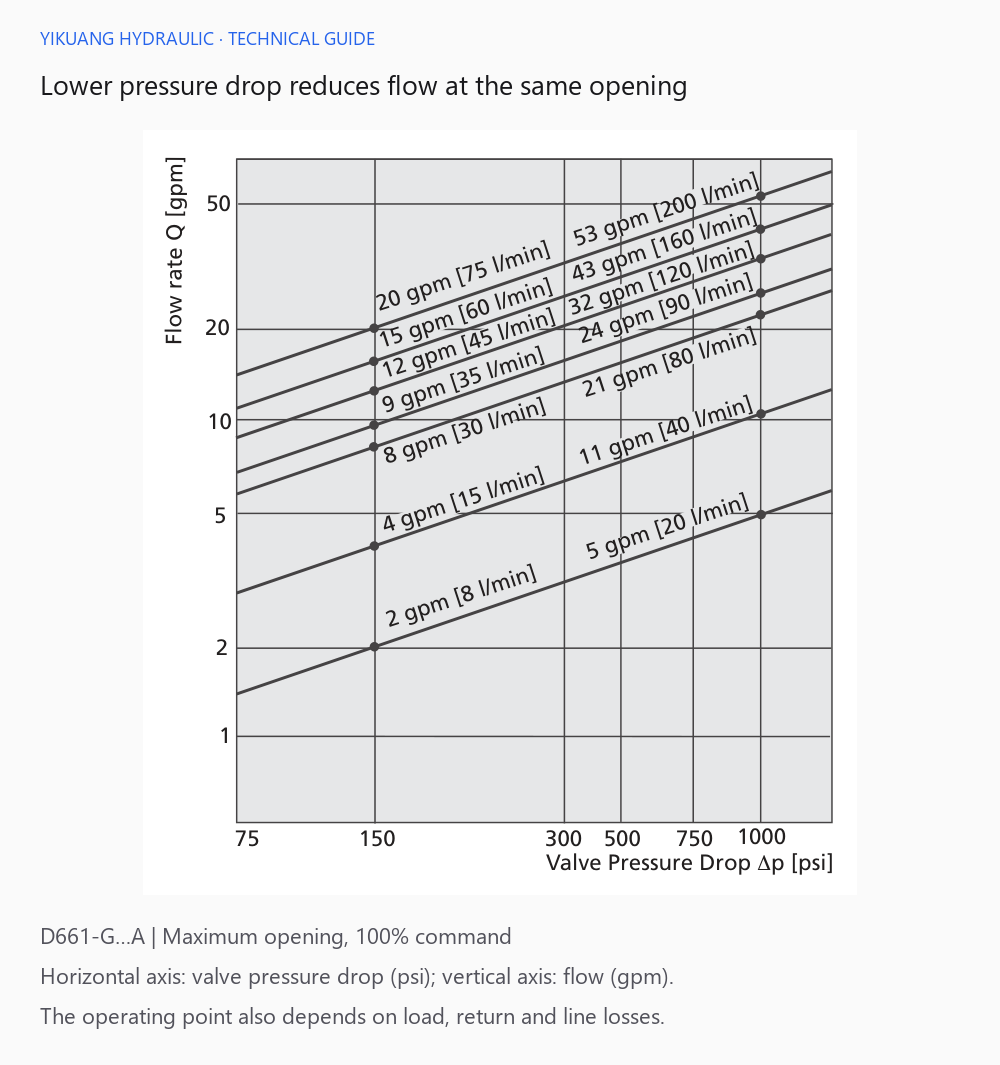
D661 series — context for this example
Compare the command, spool feedback and work-port pressures. If the spool follows but the cylinder remains slow, examine supply flow, load, line losses and the actuator. If spool response also lags, investigate valve-end power, drive conditions and the applicable pilot supply.
A larger circuit volume may need different pressure-control settings
Pressure buildup compresses fluid in the controlled volume. A larger volume requires more oil to reach the same pressure. Hose compliance, entrained air and leakage also change the buildup process.
Three sets of curves in the MOOG D691 catalog illustrate the difference.
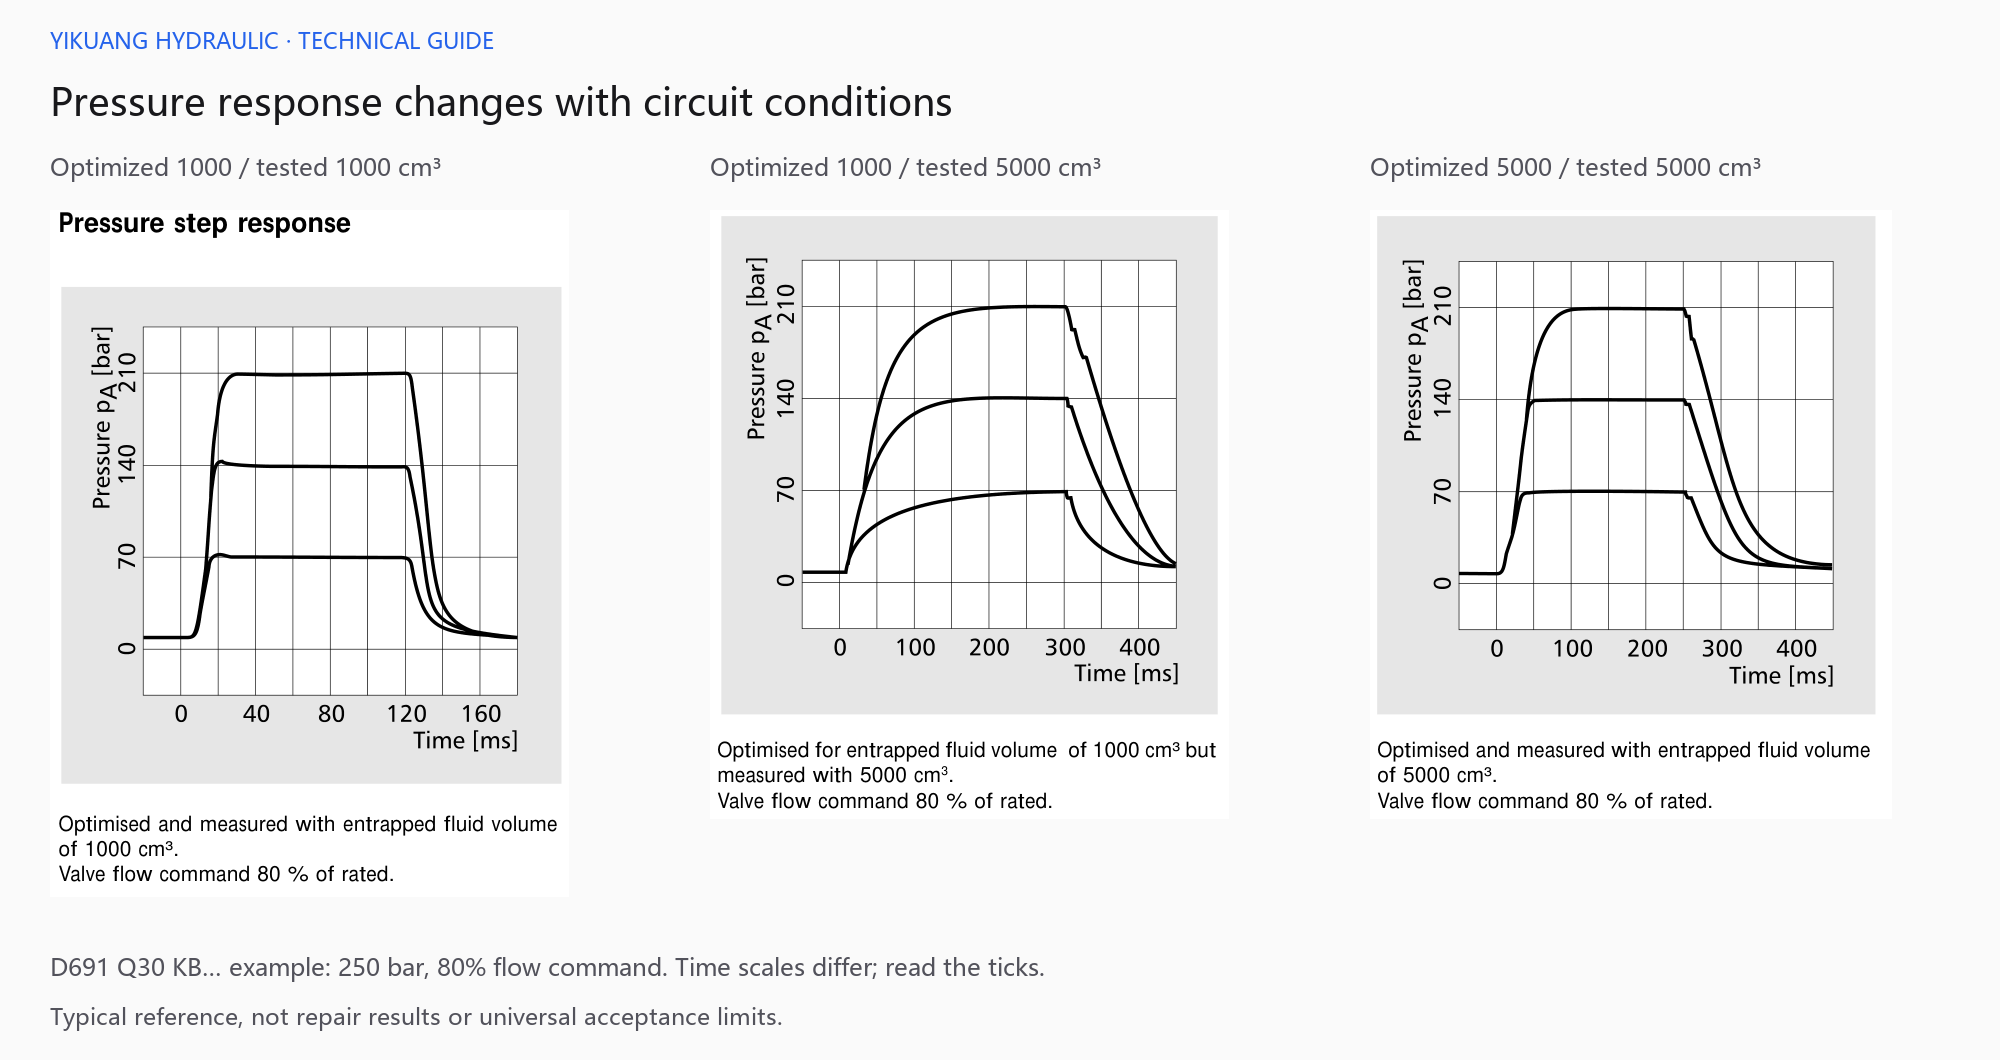
The left chart uses settings matched to 1000 cm³. The middle chart increases the test volume to 5000 cm³ while retaining the original settings. Pressure rises more slowly and the pressure-release trace changes as well.
The right chart also uses 5000 cm³, but its settings have been optimized for that volume. Its rise differs from the middle chart. Slow pressure buildup on a machine therefore calls for a review of the valve, actual controlled volume and controller matching.
I would establish the differences between the stand and machine before discussing tuning. These are typical responses for a particular configuration. Settings should be adjusted by personnel familiar with the circuit, following the machine commissioning procedure.
Check the signal at the valve, not just at the controller
A normal displayed controller output does not establish the actual signal received by the valve. Range settings, reference potentials, connector contacts and cable voltage drop all deserve a check.
Compare the complete ordering configuration with the wiring diagram. Confirm voltage or current input, feedback range and enable connections. For PQ valves, also establish how pressure and flow commands interact.
Under the machine's permitted measurement conditions, compare controller output with valve-end input. Address any discrepancy in that link before assessing the hydraulic motion. Convert command and feedback to a common reference for zero, units and range before comparing them.
When the machine oscillates, find which signal changes first
The valve's internal position loop controls the spool. The machine's external position, velocity or pressure loop controls the actual process. Sensors, feedback direction, control gain and delay all contribute to that chain.
If the command oscillates and spool feedback follows it, investigate the external loop and machine sensors first. If the command is stable but spool feedback is abnormal, investigate valve-end power, pilot conditions and valve condition. Signal trends narrow the search; testing is still needed to establish the cause.
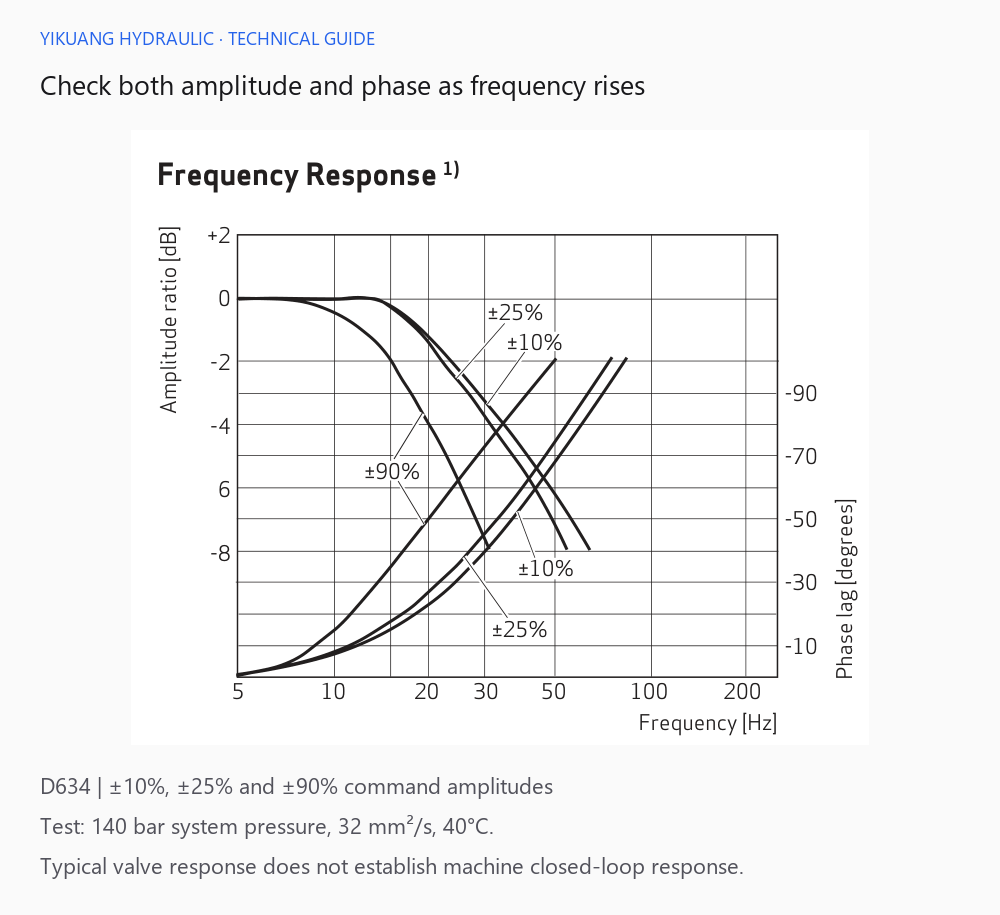
D634 series — context for this example
The chart shows amplitude and phase changes under periodic commands. The external machine loop also includes sensors, hydraulic load and the controller, so assessment of oscillation must consider phase lag throughout the control chain.
Check flow rating and spool characteristics when replacing a valve. Even within the same series, changes in flow per opening, control gain or dynamics may require reassessment of the original machine settings.
Repeat the measurements when the fault appears after warm-up
Oil temperature and viscosity change during operation. Leakage, null and resistance to movement may change with them. If the fault occurs only after warm-up, record pressure, command and feedback at that stage and compare them with cold-operation results.
For pilot-operated valves, examine pilot supply and return backpressure during startup, low-pressure motion and high-load operation. A normal main-pressure reading does not establish the effective pressure differential driving the pilot stage.
Perform measurements according to the applicable valve documentation and machine procedure. Before disconnecting or modifying hydraulic lines, control the load, isolate energy sources and release the relevant residual pressure.
| Machine symptom | Records to compare | Main checks |
|---|---|---|
| Speed falls under load | Command, spool feedback and work-port pressures | Available pressure drop, supply capacity, load and line losses |
| Slow pressure buildup or release | Pressure-time trace, flow command and controlled volume | Volume and controller matching |
| Oscillation | Command, spool feedback and machine sensor signal | Where the fluctuation first appears |
| Fault appears after warm-up | Oil temperature, pressure, null and leakage | Items that change with temperature |
| Position drifts while holding | Actual zero command, valve feedback, load and holding circuit | Input bias, leakage and load effects |
Bring the complete nameplate, stand report, hydraulic schematic and fault-condition records together. Relating the report conditions to the machine conditions gives the investigation direction. For post-repair acceptance topics, see MOOG Servo Valve Post-Repair Verification.