EMG SV1-10 Internal Leakage: Typical Values and Test Conditions
Start field checks with visible leakage, slower motion and increased position drift compared with history. Without a flowmeter, recording these changes helps maintenance narrow the search. Measuring SV1-10 internal leakage itself requires the applicable model and test conditions.
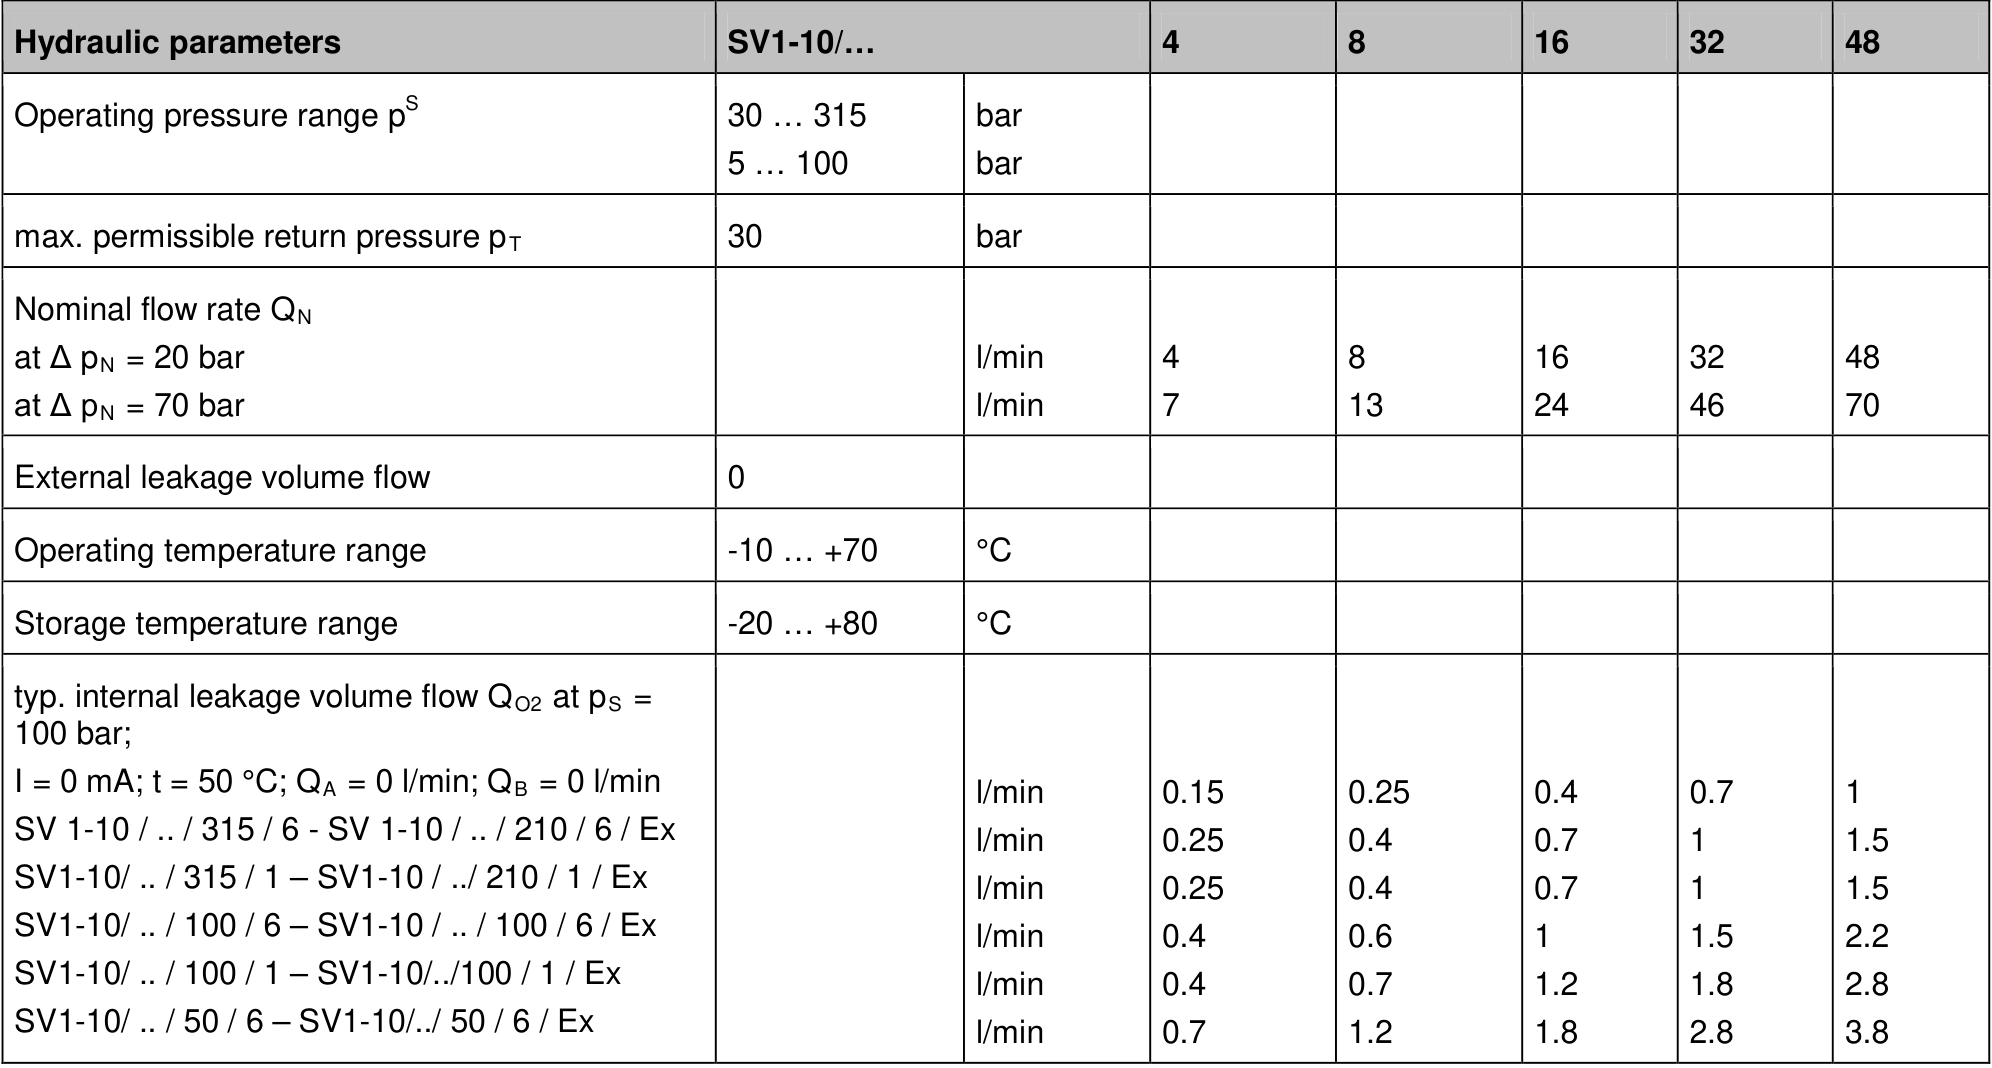
This article uses manufacturer data sheet DB_SV1-10_05_en, document ID EMGDES-00002822, primarily comparing null leakage for the 315 pressure version. Its values apply to that documented configuration and do not replace model-specific inspection requirements.
Four Checks without a Flowmeter
Without specialist instruments, screen for changes, record when they occur and pass the evidence to maintenance. These checks do not measure the data sheet's internal leakage or certify valve acceptance.
1. Observe external leakage. From a normal safe inspection position, look for fresh oil or dripping around the valve and connections. Do not feel for high-pressure leaks. No visible oil means only that no external leak was observed; internal leakage remains unmeasured.
2. Read existing instruments and displays. Record oil temperature, pressure, alarms and operating state without changing pressure for a test. Compare similar products, loads and normal operating phases. A displayed zero command does not prove zero coil current.
3. Record changes in motion. Within established safe operating conditions, observe persistent position drift, slower repeat movements and cold-to-warm differences. Use existing position displays, timing and video from a safe location; do not approach moving machinery to take measurements.
4. Give maintenance the model and records together. A complete nameplate photograph plus pressure, temperature, load, movement and timing is more useful than a general suspicion of leakage. Do not disconnect the T line to collect oil, block work ports, disconnect coils or operate manual overrides for testing. These change circuit behaviour and require qualified personnel following the applicable documentation.
| Field observation | Available inspection action | Response |
|---|---|---|
| No external leakage, behaviour close to previous records and no new alarms | Retain observations and follow the existing maintenance plan | No clear change is established; internal leakage is not certified |
| Motion slows or drift increases when warm, significantly compared with history | Record existing temperature and pressure displays plus motion video | Refer to maintenance to distinguish valve, cylinder, supply and load effects |
| New spray leakage, abnormal or uncontrolled movement, or equipment-limit alarms | Follow site stopping and isolation procedures and stay clear | Stop informal testing and involve qualified personnel |
Assume a guiding system previously ran steadily when warm but now drifts during the same production task. The operator can record temperature, displayed pressure, displacement over time and the nameplate. That supports a maintenance request, but does not establish spool wear.
If an existing position display is safely visible, a change such as 2 mm over 60 seconds can be retained as a trend observation. Different loads or commands are not directly comparable. Displacement divided by time is not valve internal leakage. The purpose is to describe the abnormal behaviour clearly.
Identify the Flow Being Measured
Internal leakage flows through internal clearances and other leakage paths. External leakage escapes outside the valve. A return-line measurement can combine valve leakage, actuator return flow and other branches. The measurement point determines what the reading represents.
The data sheet specifies typical internal leakage at 100 bar supply pressure, 0 mA input current, 50 °C and working-port flows QA=QB=0. Numerical comparison requires a compatible test arrangement that separates the flow being assessed, or a manufacturer-approved procedure.
Do not treat total T-line flow during machine operation as this specification. Record the measurement point, circuit state, pressure and temperature. Circuit changes or work-port blocking for testing must follow the applicable maintenance and test documentation.
Typical Null Leakage for the 315 Pressure Version
| SV1-10 rated flow version | /315/6 | /315/1 |
|---|---|---|
| 4 L/min | 0.15 L/min | 0.25 L/min |
| 8 L/min | 0.25 L/min | 0.4 L/min |
| 16 L/min | 0.4 L/min | 0.7 L/min |
| 32 L/min | 0.7 L/min | 1 L/min |
| 48 L/min | 1 L/min | 1.5 L/min |
All figures use the stated 100 bar, 0 mA, 50 °C and QA=QB=0 conditions. Variation across flow sizes and overlap configurations rules out assigning one universal normal-leakage figure to the entire SV1-10 family.
For example, /48/315/6 has a typical value of 1 L/min, while /16/315/6 lists 0.4 L/min. The same measured 1 L/min has different significance: investigate the /16 result further, while the /48 reading is close to its typical reference. Neither result alone establishes complete-valve acceptance.
Interpreting the Manufacturer Curve
The data sheet also plots normalised leakage against operating pressure. Its vertical axis is the ratio Q₀(p)/Q₀(100 bar). Understanding the scale requires the appropriate model's 100 bar reference flow.
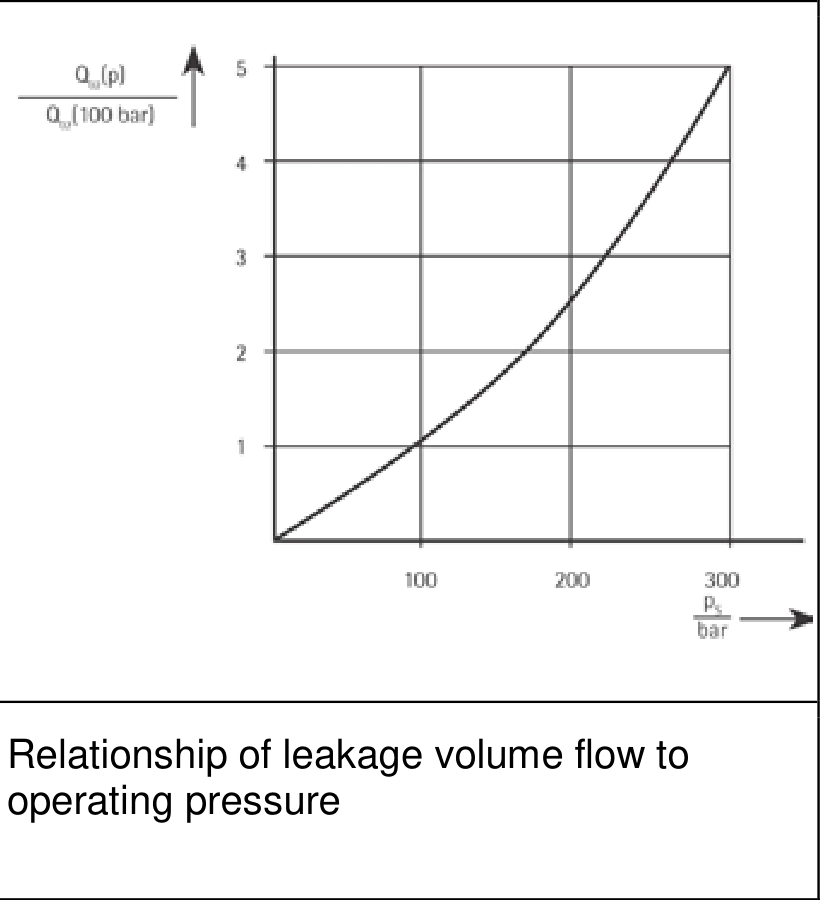
The curve shows that pressure changes leakage. Comparing a reading at 315 bar directly with the 100 bar table does not establish wear. Test under comparable conditions or use the applicable model's approved conversion and acceptance method.
Temperature changes viscosity and clearance flow as well. Without corresponding data, avoid applying an assumed fixed temperature correction to declare a field reading acceptable.
What Three Readings Can Establish
The following are assumed records, not customer repair cases. The first two assume a test method compatible with the reference conditions and measurement uncertainty small enough to distinguish the stated differences.
| Assumed record | Supported interpretation | Next step |
|---|---|---|
| /16/315/6 measures 0.42 L/min at 100 bar, 0 mA, 50 °C and QA=QB=0 | Close to the 0.4 L/min typical reference, without an obvious departure | Check remaining performance against the acceptance specification |
| Same version and conditions measure 1.0 L/min | Substantially above the 0.4 L/min typical reference; investigate | Exclude measurement-point, electrical-null and installation effects; repeat and obtain acceptance limits |
| /48/315/6 measures 2.0 L/min in a machine return line above 100 bar and at another temperature | Not directly comparable with the 1 L/min typical figure | Separate flow sources and retest under comparable conditions |
Even a repeatably high result does not identify a worn component by itself. Contamination, clearances, null offset and test installation require further investigation. Report a departure from the typical reference requiring service assessment, rather than condemning a component from a single number.
A Consistent History Is More Useful
Assume the same /16/315/6 previously measured 0.42 L/min and now repeatedly measures 0.85 L/min under matched conditions. Once the instrument, circuit and electrical null are verified, that change warrants service assessment even if a formal rejection limit is not yet available.
Retain the valve serial number, fluid, temperature, pressure, drive and dither state, measurement point and instrument details. A record stating only “leakage 0.85” cannot distinguish valve changes from test-condition changes later.
Cylinder Drift Does Not Directly Establish Valve Leakage
The quoted null-leakage figures specify QA=QB=0. Cylinder movement involves working-port flow, chamber pressures, piston sealing and load. These are different conditions and cannot be converted directly into each other.
For example, a cylinder with 20 cm² effective area moving at 0.1 mm/s has a geometric volume-change rate of approximately 0.012 L/min from A×v. This indicates the scale of motion, but does not prove that all of this flow comes from the servo valve. It should not be subtracted from the table's total internal leakage.
For load holding, assess the complete circuit's holding provisions, actual working-port behaviour and cylinder leakage. Spring centring, low typical internal leakage and reliable load holding are separate requirements.
Summary
Match model, overlap, pressure, temperature, zero current and measurement arrangement before comparing leakage. Typical values differ significantly across 315-version flow sizes. Operating return flow is not automatically the manufacturer's null-leakage quantity.
A reading near a typical value does not establish complete-valve acceptance, and a departure is not automatic rejection. Combine repeatable matched-condition measurements, historical trends and formal acceptance requirements to decide between continued use, service assessment and replacement.